Enrollment & FTE
Analyzing Enrollment
The enrollment data presented here reflect the college’s Mission, Vision & Values, specifically the following section of the mission statement: “The College enhances the economic, social, and cultural life of the communities we serve by providing face-to-face and virtual learner-centered environments that encourage access, success, and completion,” and Goal 1.1 Identifying and Defining Student Success of the 2024-2029 Strategic Plan.
|
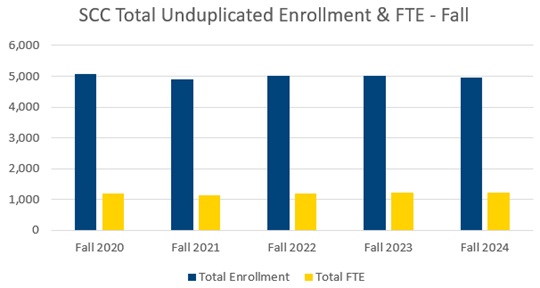
Fall Term SCC Enrollment and FTE* |
||||||||
|
Curriculum |
Basic Skills |
Continuing Education |
Total |
|||||
|
Enrollment |
FTE |
Enrollment |
FTE |
Enrollment |
FTE |
Enrollment |
FTE |
|
|---|---|---|---|---|---|---|---|---|
|
Fall 2020 |
2,701 |
878.5 |
219 |
47.4 |
2,310 |
280.8 |
5,082 |
1,206.9 |
|
Fall 2021 |
2,499 |
810.3 |
221 |
37.4 |
2,337 |
287.8 |
4,904 |
1,135.5 |
|
Fall 2022 |
2,618 |
851.5 |
297 |
50.2 |
2,282 |
305.6 |
5,010 |
1,207.3 |
|
Fall 2023 |
2,553 |
836.4 |
296 |
51.8 |
2,335 |
325.2 |
5,002 |
1,213.4 |
|
Fall 2024 |
2,732 |
904.8 |
345 |
64 |
2,102 |
242.5 |
4,957 |
1,211.3 |
*FTE (Full-time Equivalent) is a measure based on student membership hours that are used for state funding to the community college.
Excludes Continuing Education non-budget FTE.
|
Spring Term SCC Enrollment and FTE* |
||||||||
|
Curriculum |
Basic Skills |
Continuing Education |
Total |
|||||
|
Enrollment |
FTE |
Enrollment |
FTE |
Enrollment |
FTE |
Enrollment |
FTE |
|
|---|---|---|---|---|---|---|---|---|
|
Spring 2021 |
2,269 |
773.8 |
240 |
42.9 |
2,305 |
269.8 |
4,658 |
1,086.5 |
|
Spring 2022 |
2,181 |
720.4 |
255 |
40.5 |
2,389 |
265.6 |
4,671 |
1,026.5 |
|
Spring 2023 |
2,297 |
755.3 |
285 |
62.2 |
2,715 |
286.6 |
5,108 |
1,104.1 |
|
Spring 2024 |
2,303 |
753.3 |
309 |
59.3 |
2,435 |
272.2 |
4,859 |
1,084.7 |
|
Spring 2025 |
2,534 |
874.0 |
316 |
61.7 |
2,086 |
197.2 |
4,794 |
1,132.9 |

Sources: NCCCS Dashboards available at https://www.nccommunitycolleges.edu/about-us/data-reporting/data-dashboards-page/
Updated October 2025