Graduation & Retention Rates
Questions? Contact Us.
Dr. Cindy Dean
Director, Institutional Effectiveness
cdean5600@stanly.edu
704-991-0329
Analyzing Graduation & Retention Rates
The graduation and retention rate data presented here reflect the college’s Mission, Vision & Values, and Goal 1.1 Identifying and Defining Student Success of the 2024-2029 Strategic Plan.
| IPEDS Report Year | Cohort Year | Graduation Rate |
|---|---|---|
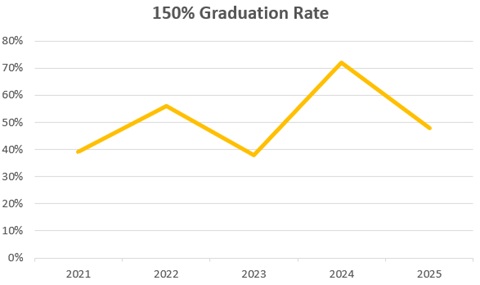
| 2021 | 2017 | 39% |
| 2022 | 2018 | 56% |
| 2023 | 2019 | 38% |
| 2024 | 2020 | 72% |
| 2025 | 2021 | 48% |

*Graduation Rates are determined by calculating the number of students completing their program within 150 percent of normal time to completion.
| IPEDS Report Year | Cohort Year | Retention Rate |
|---|---|---|
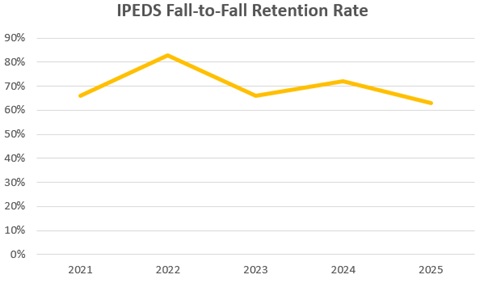
| 2021 | 2019 | 66% |
| 2022 | 2010 | 83% |
| 2023 | 2021 | 66% |
| 2024 | 2022 | 72% |
| 2025 | 2023 | 63% |

*Retention rates are based on the number of first-time, full-time, degree/certificate-seeking students who enter the institution in the fall term and who return to the same institution the following term.
Source: IPEDS
Updated: October 2025
