Success Rates in Curriculum Courses
Questions? Contact Us.
Dr. Cindy Dean
Director, Institutional Effectiveness
cdean5600@stanly.edu
704-991-0329
Analyzing Course Success Rates
The course success data presented here reflect the college’s Mission, Vision & Values, specifically the following vision statement:
“Stanly Community College will be the gateway for higher education and a positive catalyst for change in all the communities we serve;” and Priority Three of the Student Success section of the 2021-2024 Strategic Plan: “Ensure that students are learning by providing equitable, appropriate educational delivery, supported by an increased capacity to use data and evidence.”
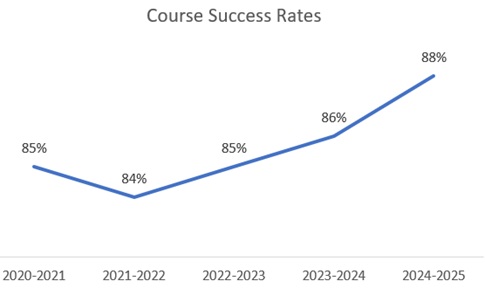
Academic Year | Success Rate |
---|---|
2019-2020 | 83% |
2020-2021 | 85% |
2021-2022 | 84% |
2022-2023 | 85% |
2023-2024 | 86% |
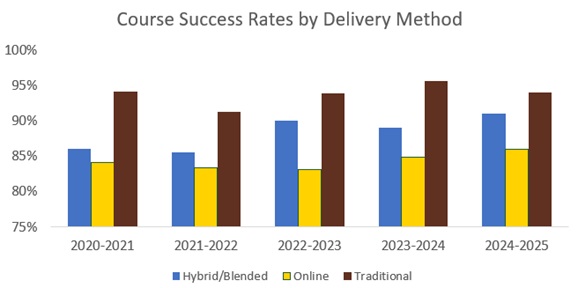
SCC Course Success Rates by Delivery Method |
||||
Academic Year |
Blended |
Hybrid |
Internet |
Traditional |
---|---|---|---|---|
2019-2020 |
85% |
82% |
83% |
86% |
2020-2021 |
84% |
92% |
84% |
94% |
2021-2022 |
86% |
87% |
83% |
91% |
2022-2023 |
91% |
88% |
83% |
94% |
2023-2024 |
91% |
87% |
85% |
96% |
*Success Rates are determined by number of students earning a "C" or better divided by the total number of students enrolled
Blended - seated course with less than 50% of online component, Hybrid - online course with less than 50% seated component, Internet - 100% online course, Traditional - 100% seated course
Source: Stanly Community College data warehouse
Updated: August 2024